VisiTrac/Basictm Cycle Reporting and Modeling Product
Version 9.6
The current release of VisiTrac/Basic is 9.6
What's New in Version 9.6?
VisiTrac version 9.6 provides a simplified flowchart definition process to speed production of your flowcharts and related reports. With version 9.6 you can now enter a list of tasks that are part of the application or the name of the application defind in your forecast or work plan -- VisiTrac does the rest. VisiTrac will use this information to identify the flowchart these tasks or application are members of and generate the surrounding task network.
The definition of a process using only tasks eliminates the need to specify Start and End jobs as was required in earlier versions of VisiTrac. The flowchart produced will reveal the overall structure of the process' flowchart. We still recommend coding Start/End jobs to improve reporting acuracy. This improvement produces a flowchart from which the user can easily locate Start/End jobs to be used for improved accuracy and/or locating different flows to be reported.
Quick links on this page:
- What is VisiTrac?
- Who Needs VisiTrac?
- VisiTrac Reports
- How does VisiTrac Work?
- Request a Detailed Product Overview
What is VisiTrac?
VisiTrac provides the user with quick and easy desktop access to an in-depth understanding of the structure and performance of any batch cycle. All the user needs to do is identify one or more cycle by start, end or embedded tasks and VisiTrac produces a comprehensive collection of reports, charts and a full-cycle task flowchart. It's that easy.
VisiTrac makes it simple to summarize, manage and track your cycles. By loading historical task execution data into the product's database you can get an instant, historical view of how any cycle is and has been executing.
When a cycle runs late, the VisiTrac reports make it easy to determine why the cycle ended late. It could be a late start, a mid-cycle delay, one or more abends, extra processing loads or any combination of reasons. A quick review of the reports will make it self-evident why the cycle has ended so late so you can take action to prevent a failure the next time.
Finally, VisiTrac provides a graphical modeling environment where changes to the cycle can be applied and the what if effect to the overall system of work can be immediately seen.
Click here to request a detailed product overview.
Who Needs VisiTrac?
VisiTrac is ideal for:
- Operations Control Managers who need to track their workloads
- Performance Technicians who want to quickly find the root of a cycle's troubles and model performance changes
- Upper-Management who wants to see a daily report on workload health and monitor SLA compliance
- Application Project Teams who need to understand, modify and model changes to a cycle before the changes hit the production phase.
- Customers and I/T Professionals engaged in establishing and monitoring Service Level Agreements for batch process execution and completions.
- Disaster/Recovery teams who need to understand the construction of a cycle for D/R planning.
- Customers of outsourcing firms who need their own tools to monitor the outsourcing company's performance.
VisiTractm Reports
VisiTrac assembles all the reports and flowcharts into one file for immediate access through the Windowstm desktop component. From the Windowstm interface the output can be directly viewed and printed. VisiTrac supports interactive desktop modeling to check the effect of application and tuning changes prior to production implementation.
VisiTrac has something for everyone in your organization. The following is a high-level listing of the reports always available.
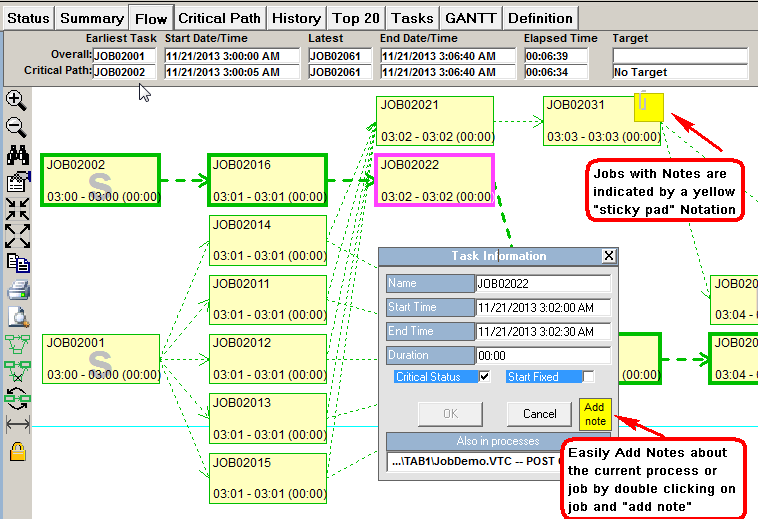
- Task Flowchart
The Task Flowchart provides an interactive view of all the tasks in a cycle. Through the flowchart you can visually see what tasks are part of the cycle, how tasks relate to one another and what tasks form the Critical Path which leads to your selected end task(s). This excellent task flow documentation tool is also an interactive modeling tool which allows you to test changes to the cycle and receive immediate feedback on the effects of those changes to the overall cycle. The Flowchart is one of the most popular features of VisiTrac aiding the user in visualizing, documenting, debugging and modeling any cycle. - One-Page Summary
The One-Page Summary is a high-level 'executive summary' of all the cycles defined to VisiTrac. There's one entry for each of your SLAs showing statistics for the last completed cycle -- for example: when did the cycle end and were there any exceptions noted. This report is ideal for use in daily cycle tracking for staff turn-over and general publication. - Process Performance Report
The Process Performance Report provides you with a line chart showing the completion time history of your cycles. The report shows both the historical Actual completion times and a user-definable, running-average Trend line of completion times. Through this report it's easy to see which cycles are in trouble or are heading that way. Armed with this knowledge you can direct your preventative tuning efforts for the most effective overall results. - Critical Path Report
The Critical Path Report provides a textual summary of all the tasks which make-up the Critical Path to the cycle's latest ending task. Included in this report are indications of which tasks have made the cycle late (if applicable), which tasks are running historically long and which tasks appear to have experienced an Abend/Restart event. Also included are any significant delays occuring in the critical path. - Top-20 Critical Path Report
The Top-20 report provides the user with a graphical view of the 20 longest running critical path tasks in the cycle. The data is presented in a bar chart and sorted by current task execution duration - longest to shortest. Along with the actual duration bar, you receive a user-definable average duration bar and CPU time component. You can compare the average and actual duration bars to identify tasks which are running longer than typical and quickly apply your skills to tune and improve the cycle's critical path. - Gantt Chart
The Gantt Chart provides a graphical view of task activity by time throughout the duration of the batch cycle. Tasks are sorted down the side by start time while activity is graphed throughout the execution of the cycle across the width of the chart. A cumulative count of active tasks and average CPU is shown in graphs syncronized with the chart's timeline at the bottom of the report. The Gantt chart provides a quick method to identify when cycles are least active. This is ideal for planning when new work can be added or when maintenance windows should be planned.
Click here to request detailed examples of these reports.
How does VisiTractm Work?
VisiTrac collects your task execution history and process scheduler data, storing the data in its database. Reports are produced through a VisiTrac report process that integrates the stored data and your user parameters to identify and report on each process defined. Both task history and schedule data is collected using standard interfaces so the installation is seemless, requiring no system modifications or gens.
Report output is shipped to your Windows desktop where it can be viewed through our VisiTrac desktop viewer. The desktop component provides report access and criteria adjustments for customized viewing. The component also includes an advanced modeling facility to conduct "what if" scenario testing of changes before you implement.